We’ve been collecting printing data through a PaperCut printing service installed on all of our print servers in the district since last spring. This data collection has been part of an eventual plan to reduce printing and paper use to reduce the district’s carbon footprint.
One of our schools uses a crediting and web based printing option on the system. Students cannot hit print and have something come out of a printer. It is onerous compared to the usual way of printing but the district average for print jobs per student in the last thirty days was 19.4 pages and 4.1 at the school with the crediting and web print option turned on.
Looking at the reports that can be generated from the systems, there is a lot of data. This real world data could be used to help challenge schools to reduce and carefully use printing resources in schools. It could also be used in the classroom as a curricular resource.
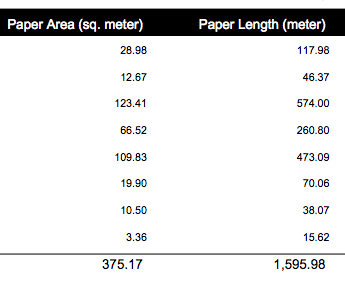
This graphic below shows the area of paper used via printing for the last 30 days for one of our elementary schools with open, uncredited printing. It also shows the length if you put the pieces end-to-end. Each line represents a different printer in the school and the totals at the bottom.
Many questions could be posed to students and here are a few that come to mind:
- If we had to replace one of the printers with a new printer that could handle a higher volume, which one would it be and why?
- Which printer would you remove and why?
- How many square meters is our gym? In the last thirty days could we cover the floor from the printing from our printers?
- How many square metres of paper is wasted? (one day of keeping track of what goes into the recycle bins might help with this one)
- What is the cost of all that wasted paper in terms of dollars and the environment?
- How can we reduce the amount of paper we use printing?
- If we put all of our printing in the last 30 days end-to-end at the front door of the school, where would it reach to in the community? If we used a similar amount of paper through the whole school year, where would it reach to?
If you’d like your schools data on printing just let me know in the comments, or by email and I’ll pull some reports. I would love to see how it can be applied in the classroom!

